Solar panel monitoring in application: data and warnings
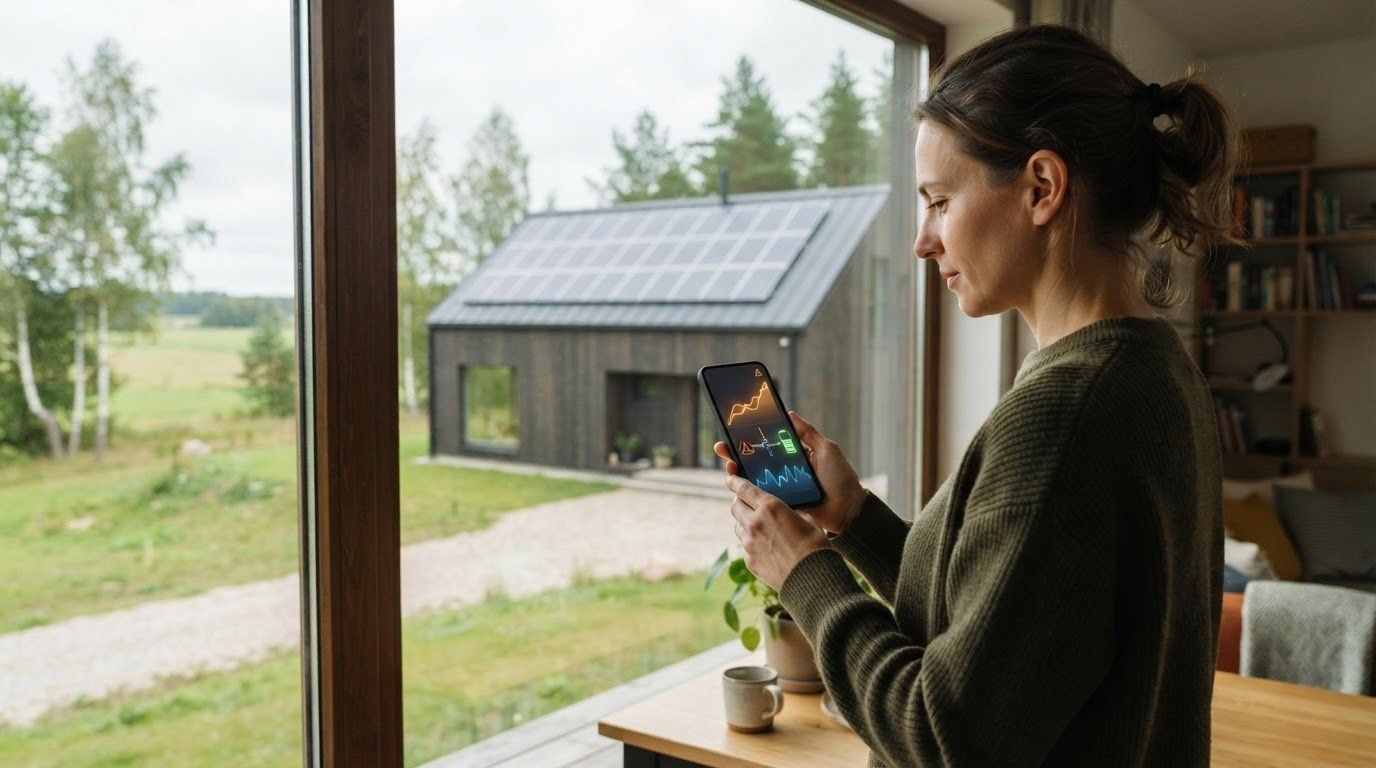
Monitoring solar panels in the application allows you to monitor electricity production and consumption in one place, as well as compare current readings with historical data. Depending on the system application, information may be available in real time and for a day, month, year or entire period of operation.
It is useful to see how much electricity panels produce and how it is used in the house. However, one reading does not tell us whether the system is working normally. It is also important to compare data dynamics and readings at different times.
In this article, you will learn how to read production, consumption and performance readings in the app, compare historical data and interpret unexpected changes. Let's also look at warnings and how monitoring helps to give timely attention to possible system problems.
Monitoring of energy production, voltage, current and consumption data
In the main view of the app, compare the power produced by the panels with the consumption of the house. Data can be available for the day, month, year and entire operating period. For example, the daily view shows whether the largest consumption matches the time of solar energy production. Historical data helps to distinguish a normal seasonal decline from sudden changes.
If the voltage and current are seen in the app, these readings help to assess the functioning of the inverter or panel strings. Voltage is measured in volts, current in amperes, but the energy produced in kilowatt hours. If one string of readings is significantly different from the others, compare them under the same conditions and time period. A separate reading itself does not reveal the cause of the changes.
The battery collects the electricity produced for later use, for example, in the evening when the panels are no longer producing enough. Check the app when the battery recharges, when it transfers energy to the dwelling and what part of the consumption is covered by the energy produced by itself. If the battery is unable to provide the entire daily consumption, the consumption and charging schedules help you understand when electricity is taken from the grid.
When selecting an app, check that it shows power generation, consumption, battery operation and historical data. Also, assess whether the required readings are understandable in one view rather than scattered in several menus.
The application fee and function depends on the conditions of the particular system and app. Read its description and access rules before use.
In Latvia, you can see the production and consumption indications in the app if the system collects them. Net accounting or electricity accounting information is separable from inverter data, therefore compare the app readings with the corresponding accounting data.
The risk of data privacy is related to your account access and the possibility to discover your home's consumption habits. Use a unique password, turn on additional login protection if available, and do not share your account access data publicly.
The efficiency is improved by regular comparison, not by healing one-day number up. Mark periods with similar weather conditions, consumption and battery charging, then review deviations. Ministry of Climate and Energy The description of the national support programme refers to the 15 000 € ceiling.
To increase the share of solar energy you consume, match most electrical appliances with the time of production. For example, compare washing time with the daily production curve.
Real-time and historical monitoring of solar photovoltaic system data
Remote access requires an application compatible with the installed inverter. The solar panel monitoring capabilities in the application depend on the system manufacturer and data connection.
Inverter monitoring applications
Invertera app is a digital tool for monitoring the system on your phone. In Latvia, examples are Huawei FusionSolar, SolarEdge and Fronius apps. They are designed to work with the solutions of the manufacturer, so the most important benchmark for comparison is compatibility with the specific inverter.
The solar photovoltaic monitoring mobile applications are designed for Android and iOS devices. Before you choose whether the manufacturer's application is available for your operating system and can be connected to the specific device. This helps to avoid a situation where the app is installed on your phone but cannot be linked to it.
Equipment for remote monitoring
Remote data transfer requires a compatible inverter and communication solution. The monitoring device may collect information from one or more inverters using the RS485/422 interface. An integrated Wi-Fi can connect the device to the router, while GPRS data recorder provides mobile data transmission.
Smart meter is required if house consumption or energy flow between house and electricity grid is to be accounted for. The meter must be compatible with the rest of the system. The meter and meter have different functions, so one does not replace the other.
Connecting the system to the app
To start connecting, select the appropriate manufacturer application for the installed inverter. Create a user account and connect the system to the app according to its instructions. Then connect the inverter to the router or your intended mobile data device.
After setting, check that the connected device and its communication status are visible on the account. If more than one household member is using the system, give each individual access instead of sharing the password of one account. Thus, each one connects to its profile, but the system remains attached to the platform of the manufacturer concerned.
Real-time performance monitoring of solar system
Real-time monitoring helps to see if the system continues to produce electricity. Follow the production curve and pay attention to sudden falls or the moment of production stopping. If, for example, on a sunny day you can see zero production, check the status of the system and the warnings. This deviation is a reason to find out whether changed circumstances or a technical problem occurred.
Compare similar periods, not just one reading. Clouds, shading and dirt on the surface of panels affect the manufacturing curve differently. If the fall recurs for several days and cannot be explained by the weather, write down when it started and how long it continued. This information helps to better assess the possible cause.
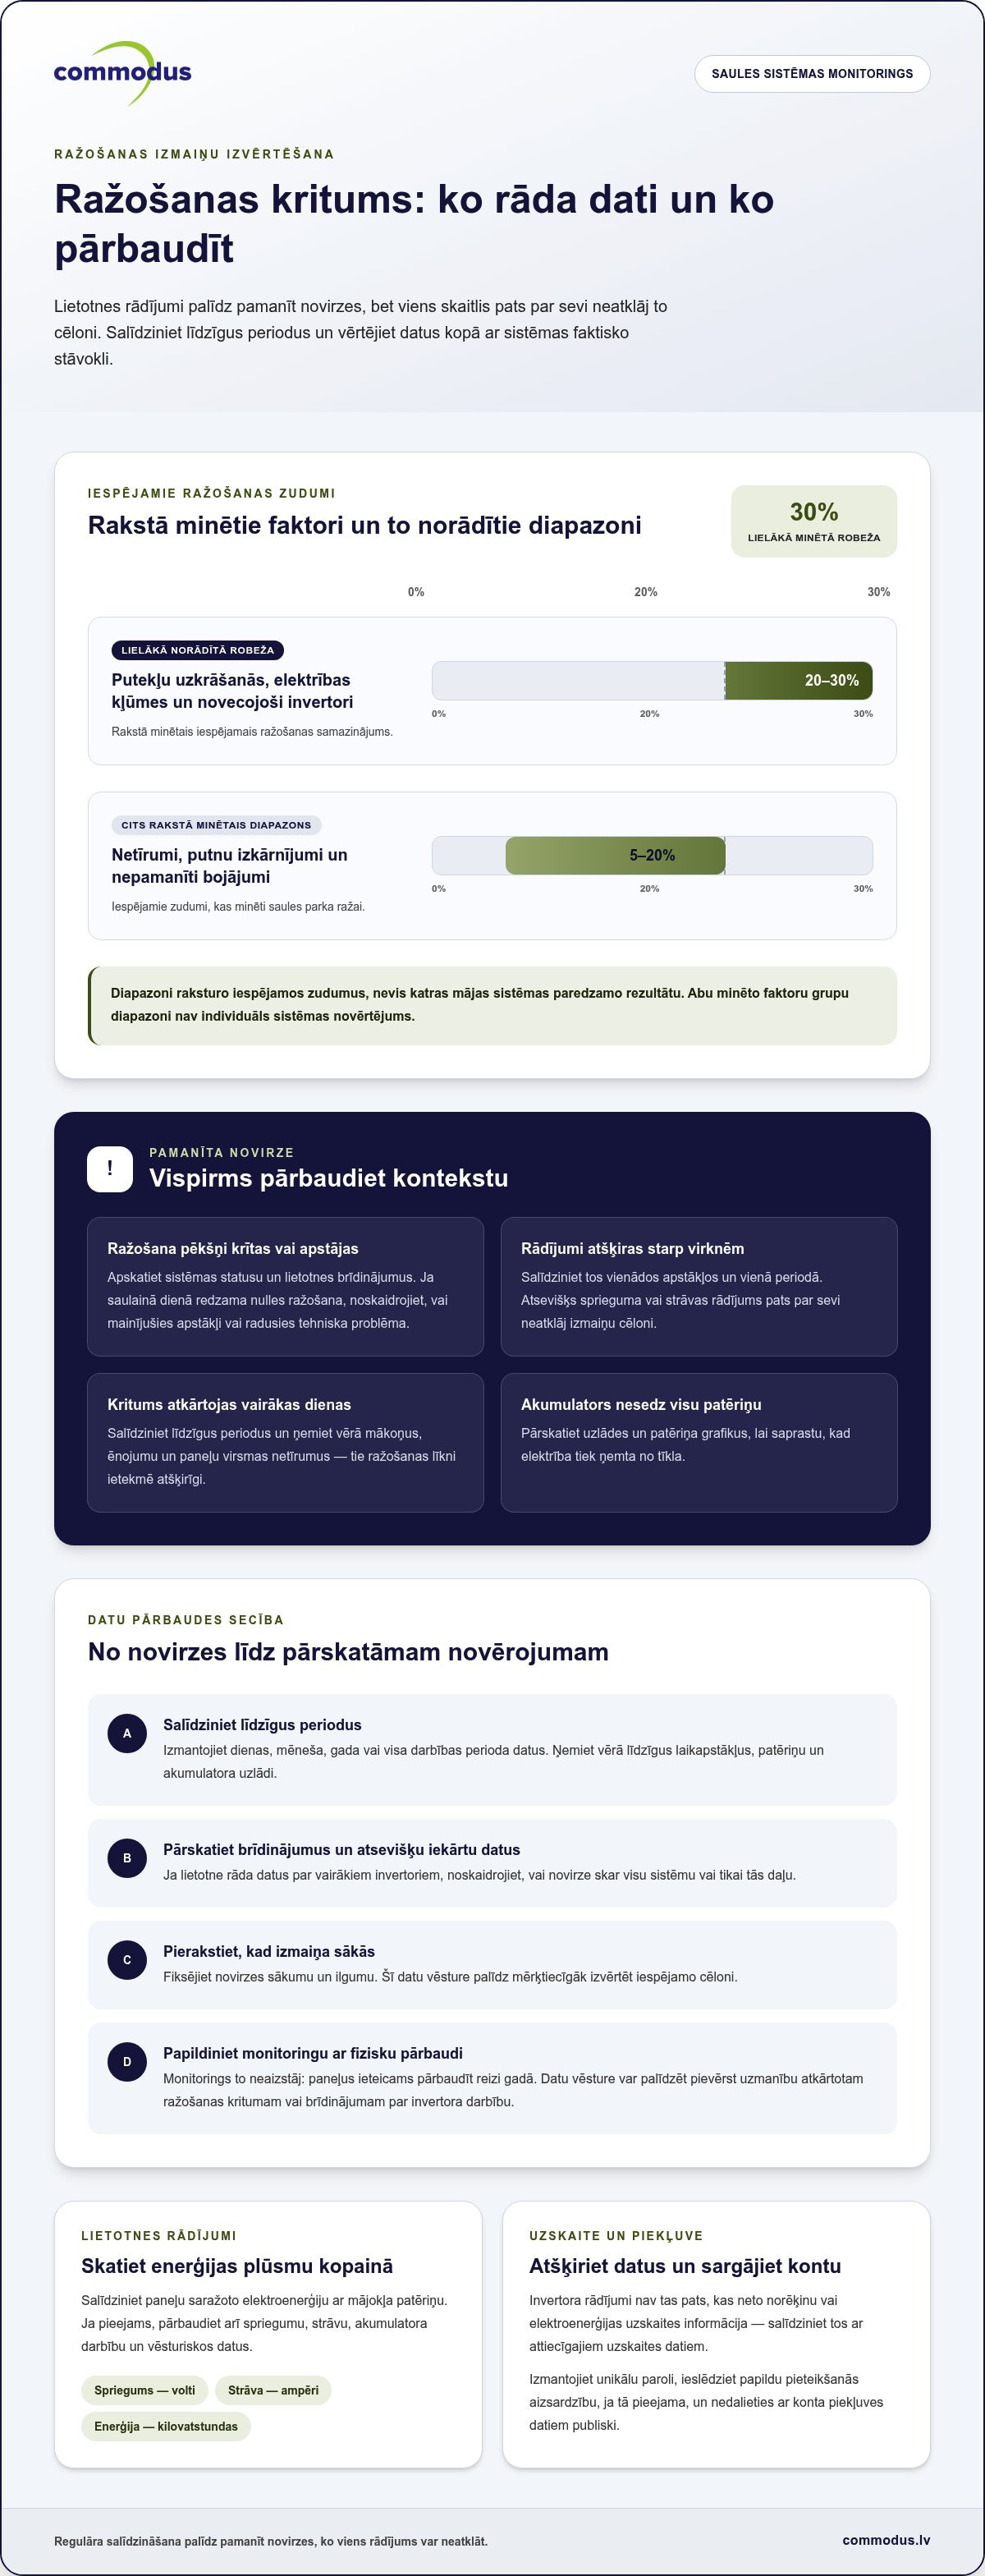
Dirt, bird's faeces and unseen damage to the solar park's yield can be reduced by 5-20 percent. Assure points out that dust accumulation, electrical failure and ageing inverters can reduce solar energy production by 20-30 percent. These indicators represent potential losses rather than the expected result of each home system. Therefore, assess the data of the app together with the actual state of the system.
If the performance schedule changes, review system warnings and compare individual inverters data if the application shows them. Record when the deviation starts and whether it affects the whole or only part of the system. Regular monitoring helps to detect inefficient performance and possible damage in a timely manner. Preventive maintenance and early detection of problems can help to reduce repair costs.
Monitoring does not replace physical examination. Panels are recommended to be checked once a year. Data history of this check is supplemented by specific observations, such as repeated fall in production or warning of inverter operation. Thus, attention may be paid not only to the panels themselves, but also to changes in the operation of the whole system.
In the description of the monitoring set, please see how the data is transferred to remote monitoring. The set may include an integrated Wi-Fi connection to the router that sends the data to the web server. It is important to understand the data path: from the monitoring set through the router to the server. In evaluating the solution, check whether the description indicates the following type of connection.
When assessing the type of monitoring, distinguish data transmission with an integrated Wi-Fi from the solution using a GPRS data recorder. These descriptions show how data are sent for monitoring. Check the description of the set to understand which solution is used in it and how it corresponds to the type of monitoring chosen.
Warnings about problems with panels or wiring
The app warning should be evaluated together with its time, name and error code. These details help to understand whether the notification refers to the production, inverter status or data connection. One-time warning after switching on the system should be assessed differently than a message that recurs for several days. Keep the screen image before the notification disappears from the main view.
If there is no data in the application or if the connection is missing, check the time of the last update and the warning text. If the update time does not change, but the system is not in a state of error, it is possible to have data transmission out of power instead of power generation. If you also see an error code, write it down precisely and compare it with the application explanation.
Several notifications do not necessarily mean several single lesions at the same time. Sort them up after the time of onset and find out which warning was the first. For example, an initial inverter notification can explain later warnings about the production or data connection. This sequence provides more information than evaluating each notification separately.
The monitoring device's operational status can be checked with 4 light diodes in the panel. Write down which diodes are burning or flashing and compare their signals with the explanation of the particular device. The app warning time and the display of diodes together provide a more accurate description of the event than one display.
If the warning is repeated or indicates a failure in the electrical installation, do not draw conclusions under the general notification heading. Send the specialist the error code, the notification time, the screen image and the status of the relevant diode. These specific data help to distinguish a single warning from a repeated system failure and to determine which part of the system needs to be addressed.
Monitoring system can display power generation and consumption for a day, month, year or entire operating period. Regular monitoring helps to ensure that solar system continues to produce electricity and to detect possible inefficient operation. Production and consumption indications help to understand whether attention should be paid to system warning or mismatch between consumption and energy storage.
The private owner's battery was not large enough to provide electricity for the whole day. The electricity bill of the private owner in January was 400 euros, and included heating, ventilation, hot water and electric car charging. Before installing solar panels, the electricity bills of the private owner were not lower than 100 euros. Such data does not prove the failure of panels or wiring. Nord Pool's electricity price in Latvia is determined and changed every 15 minutes, therefore the amount of the invoice should not be compared to a specific technical warning.
Commodus: Air conditioning
Commodus offers solar panels for housing that are important both for electricity generation and for the possibility of monitoring the system. When selecting the kit, consider which data is essential to you: energy produced, consumption, storage or warnings about changes.
If you plan a solar panel system or want to compare a set with home needs, the Commodus offer is a suitable next step. Commodus solar panels and choose the most convenient way to communicate about your plan.
Choose the next step in your home energy planning
Monitoring solar panels in the application helps you to understand better how the house uses energy and what needs to be considered in future planning. Write down the most important observations and consider how they affect your plans for home energy systems.
If you want to discuss the most suitable direction for your home, contact CommodusA thoughtful next step begins with your needs.
Comments